
If all you did was listen to Treasurer Scott Morrison on budget night and the half-baked media commentary that followed, you could be forgiven for thinking that Australia has practically paid off its debt, the good times are already rolling and that the only ‘losers’ are going to be a few drug dealers and tradies dealing in cash:
…the Government has been working to strengthen the Australian economy and get the budget back on track.
And we’ve been making real progress.
The Australian Bureau of Statistics figures show that almost a million jobs have been created since we were first elected, as promised. This includes 415,000 jobs last year alone. More than a thousand jobs a day, three quarters of which were full time.
Businesses are responding to improved conditions by investing again, confidence is up. More new businesses are being started.
[TMR: Hmmmm, how’s that GDP growth looking Mr Treasurer?]
…
In response we will be implementing the recommendations of our Black Economy Taskforce, targeting sectors where there is higher risk of under reporting of income.
This is expected to bring in $5.3 billion over the next four years [TMR: from who exactly? Let’s hold that thought…].
These measures include outlawing large cash payments of greater than $10,000 in the Australian economy.
This will be bad news for criminal gangs, terrorists and those who are just trying to cheat on their tax or get a discount for letting someone else cheat on their tax.
It’s not clever. It’s not OK. It’s a crime.
And then, of course, there was this:
We have made responsible Budget savings — $41 billion legislated since the last election — to get spending under control.
We are no longer borrowing money to pay for everyday expenditure like welfare payments.
Now that you’ve re-positioned yourself back in your chair, let’s keep those last two statements in mind as well.
As you’re about see from TMR’s 2018-19 federal budget analysis, it pays not to listen to what is being said, but instead to watch what is being done – lest you allow someone take a leak on your shoe and tell you that it’s simply a bit of rain.
If you want simple, no-nonsense budget analysis that can’t be found anywhere else – and a proper look under the hood of our federal finances – read on.
All figures have been sourced from the official 2018-19 budget papers and are presented so that you can form your own opinion.
2018-19 Federal budget overview
Official inflation: 1.9%.
Average annual wage growth: approximately 2.1% (what will you do with your 0.2%?).
Revenue: anticipated to go up by plenty – $28.6 billion (6.4%).
Spending: also to go up by plenty – $19.8 billion (4.2%).
Forecast deficit: $14.5 billion.
Federal debt: will continue to go up by plenty, with plenty more interest being paid on the loan.
Let us pray.
If you’ve been a reader of TMR over the years then you’ll be well aware that the federal government doesn’t have anything resembling a revenue problem.
As you’ll see below, nothing has changed with this year’s budget.
This time last year, the federal government anticipated that its revenue from 2016-17 to 2017-18 was going to increase by a hefty 6.9% (from $405.7 billion to $433.5 billion).
As it turns out, the federal government’s revenue actually went up from $409.9 billion to $445.1 billion – an insane actual increase of 8.6% (see pages 11-5 and 11-6 here and page 5-5 here).
Did you get an 8.6% pay rise last year?
This year, the federal government is expecting to tone things down a little and increase its revenue by a more ‘modest’ 6.4% (from $445.1 billion to $473.7 billion).
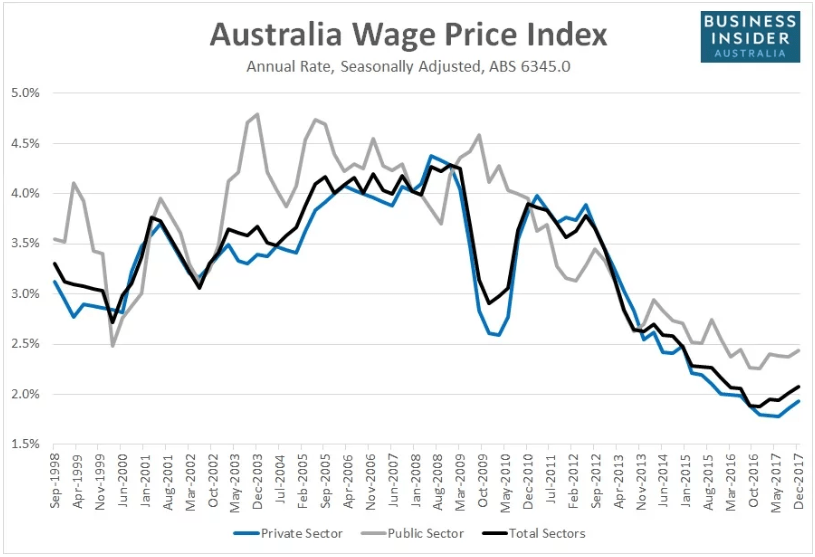
As for everyone else, an ‘inflation-busting‘ raise of around 2.1% will simply have to do.
Actually, not so fast… Those in the private sector (1.9%) – please stay right where you are. Those in the public sector (2.3%), please don’t spend your 0.4% real improvement all at once:
Are you enjoying your hamster-wheel yet?
Would you like another carrot cube?
As the graph below shows, we are living in some of the most exciting of times for the federal government – as it has far more money at its disposal than it knows what to do with:

If you don’t quite believe me, then please tell me how else one would explain things like the government’s desire to literally push water up a hill and take energy out of the grid for a cool $4.5 billion – up from an initial $2.5 billion? (Among many, many other things).
By the way, isn’t it great how billions can simply be frittered away like this with barely an eyelid being batted – or even a whimper from the opposition?
How are those ‘responsible budget savings’ looking now Mr Treasurer? (PS: yes, I’m only just getting started on this).
I’ve said it before and I’ll say it again: it’s incredible that you will not find a chart like the one above anywhere in the budget papers or anywhere else on the internet. It says everything you need to know about our federal finances over the last 10 years – and it should be compulsory for every politician to have it tattooed on their foreheads.
As for the federal government’s revenue, just stop and look at those last two bars for 2017-18 and 2018-19 and see how much larger they are than the previous bars – and how quickly they have grown (about 15.6% and $63.9 billion if you want to be more precise about it).
So where has all the extra money come from this time around? I’m glad you asked! Let’s ask the government (see page 5-12):
Company tax receipts are forecast to grow by 22.1 per cent in 2017-18 and 6.7 per cent in 2018-19. The strong growth in 2017-18 is driven by increasing profits in the mining sector owing to higher commodity prices over 2017-18. There is also a contribution from other sectors, which is consistent with the economy’s continued transition to broader-based sources of growth.
Speaking of commodity prices, I wonder what might have helped them go up? (PS: Yes, that’s TMR calling it around 18 months ago).
All up, company tax receipts went up by around 20.3% ($68.4 billion to $83.5 billion). Meanwhile, personal income tax receipts went up by around 6.3% ($179.4 billion to $190.6 billion) (see page 5-17) – presumably because there were some more jobs available in mining (among other things).
Those taxes aside:
- increased super fund taxes chipped in around $3 billion (an increase of about 35%);
- the new
everybody taxbank levy added about $1.1 billion to the mix; and
- the federal government also did as promised in last year’s budget and gouged the absolute stuffing out of smokers to the tune of an extra $1 billion (a 10% increase from $10.45 billion to $11.5 billion – see page 5-17).
But wait smokers! I know you want more! Just have a look at what’s coming your way in 2019-20: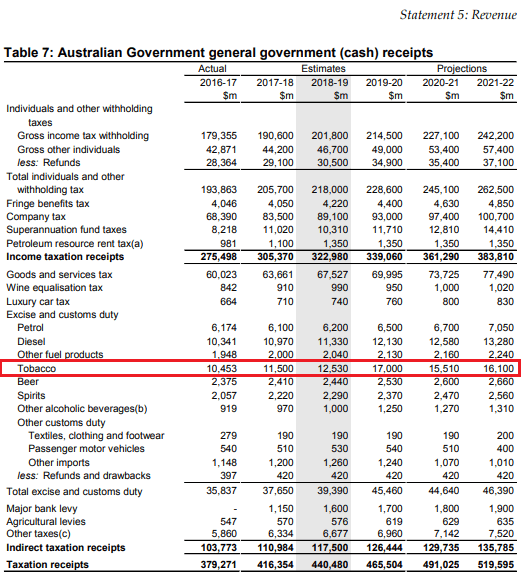
If you thought last year’s tobacco excise hike was bad, then how does the prospect of 3-4 times worse make you feel?
Then again, I’m sure it will all be ok: after listening to the Treasurer, I’m pretty sure only those nasty tobacco barons will end up paying for this and not you. Nope, definitely not… Well, maybe you’ll pay just a little bit – but definitely not more than a cup of coffee a day’s worth. Promise.
The ‘tax speed limit’ (patent possibly pending)
In the face of all this extra money, Morrison has tried to be crafty with his 23.9% ‘tax speed limit’ (tax receipts as a percentage of GDP). Aside from being:
- completely arbitrary in nature;
- ignorant of the $28 billion or so in ‘non-tax receipts’ which the federal government currently receives (see page 5-15); and
- easily removed by the next Labor government,
Morrison has done this to hide the reality that the federal government’s total cash receipts and spending are expected to sail into and remain at historically high levels at over 25% of GDP (yes, there’s a chart on this coming very soon below).
Any time someone dribbles some nonsense about ‘percentages of GDP’ and ‘tax speed limits’ as justification for our federal finances being ‘ok’ or ‘sensible’, just tell them that these charts don’t lie:

For some fun at home, try and work out the last time a federal Liberal government:
- spent more than 25% of GDP for three years in a row; or
- never achieved a single year of spending below 25% of GDP?
As for the current federal Liberal government, it’s about to notch up its fifth year in a row of spending more than 25% of GDP – and, yes, it has not spent below 25% of GDP so far.
Suffice to say, the federal government cannot expect to keep maintaining its revenue and spending like this. Something will have to give sooner rather than later. History shows that people don’t take kindly to the government taking 25% out of the economy for too long.
How Bill Shorten thinks he’ll be able to sustainably get away with taking and spending even more than this is completely beyond me.
The analysis here is simple: look at spending for the financial year about to end (2017-18), compare it to the budgeted spend for the next financial year (2018-19), see where the biggest changes are – and then ask ‘what the hell are you doing with my money and why you nefarious bastards?!’.
NB: looking at anything beyond the upcoming 2018-19 financial year (i.e. forward estimates) is largely pointless. Governments are already worse than the IPCC when it comes to forecasting.
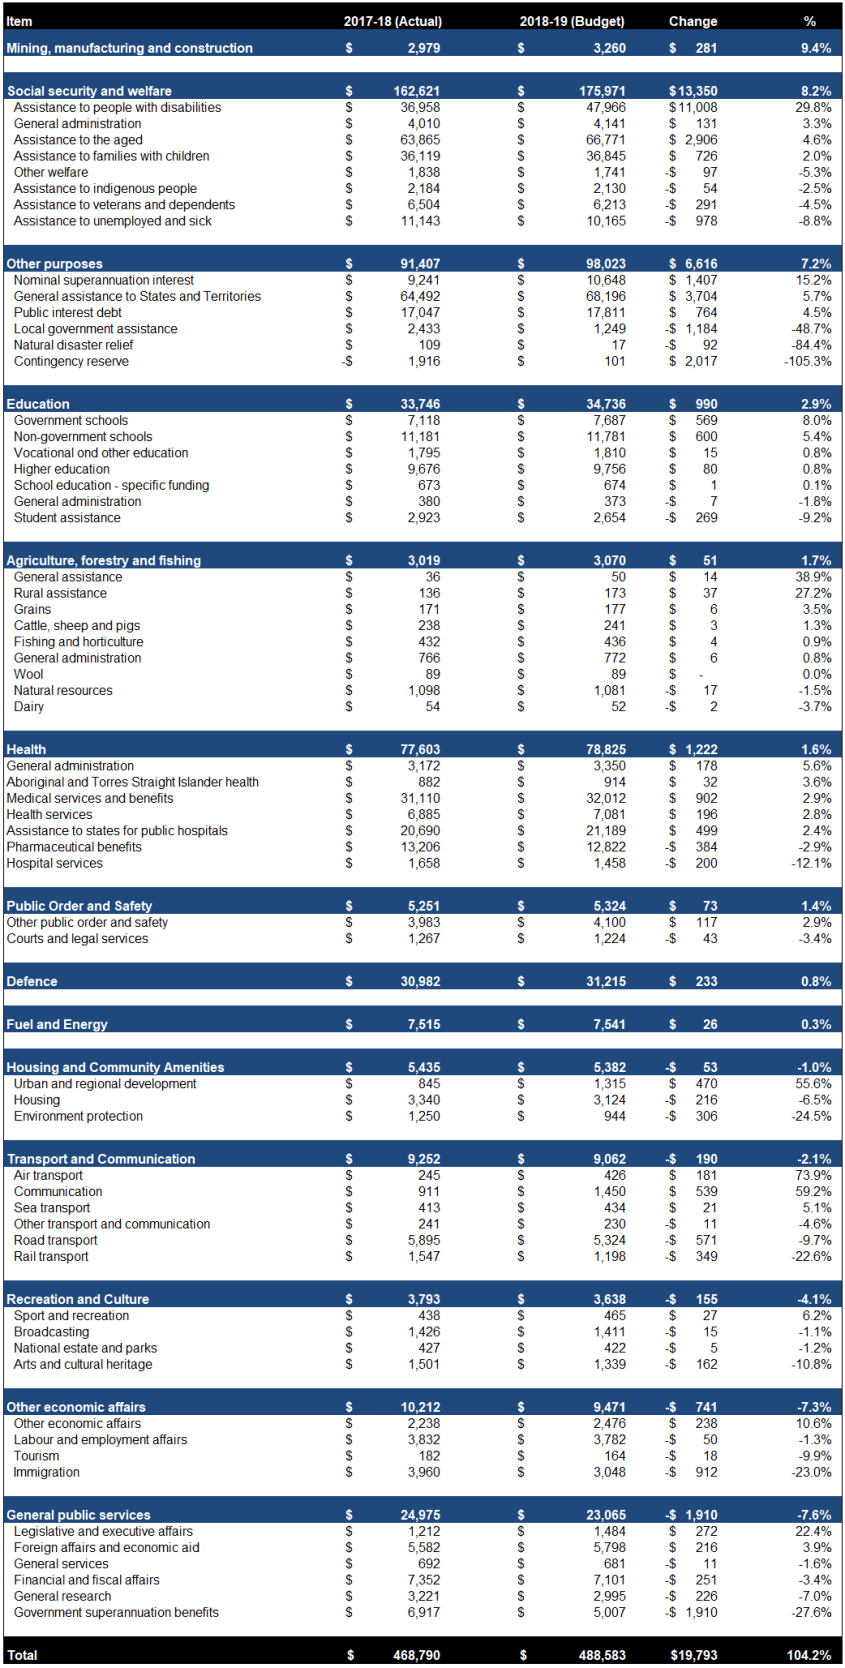
For each major government function, the following table shows:
- the 2017-18 budget figures from last year (i.e. what the government thought it was going to spend);
- the 2017-18 actual spending figures (i.e. what the government actually spent). This was a new feature introduced in TMR’s budget analysis last year – and it tells us some pretty interesting things;
- the 2018-19 budget figures for the upcoming financial year; and
- the budgeted increases and decreases for the upcoming 2018-19 financial year in plain dollar and percentage terms.
For further ease of reference, the functions have been ordered by percentage change (I know, I know, I’m a radical, game-changing disrupter).

(Figures are in millions of dollars – see also page 6-7).
The first general things to note from the above table are that the federal government:
- intends to increase overall spending in 2018-19 by 4.2% ($19.8 billion); and
- intended to spend $464.3 billion in 2017-18 (an increase of 3.0% on the previous year’s $450.5 billion) – but looks like blowing that out by around $4.5 billion to $468.8 billion (i.e. an actual increase in spending of 4.0%).
To put this in some perspective, the current inflation rate is about 1.9% and the annual wage growth rate is 2.08% (about 1.9% for the private sector and about 2.3% for the public sector).
Those things aside, the following may have also come across your mind on reading the above table:
- How did the federal government manage to blow the budget by around $4.5 billion last year and increase its spending by 4.0% instead of the budgeted 3.0%?
- How and why did health ($2.3 billion), other economic affairs ($0.8 billion) and general public services (
a Snowy 2.0$4.3 billion) blow their budgets out by so much in 2017-18?
- Why will welfare be increased by $13.3 billion in 2018-19 – and at a rate (8.2%) that is double the overall average and NEARLY QUADRUPLE THE AVERAGE ANNUAL WAGE GROWTH RATE?
- On what basis does the government now think that it can simply cut ‘general public services’ by about $2.0 billion?
- Why is spending on ‘other purposes’ going up by $6.6 billion – and at a rate (7.2%) that is 70% more overall budget average?
- What ‘responsible budget savings’ is Morrison bloody well talking about?
Dipping our toe into ‘other purposes’
I love other purposes. I think I’ll put it down somewhere in my next bank loan application.
For those not familiar with ‘other purposes’, allow me to put it in the government’s own words (page 6-8):
Other purposes – the increase in expenses from 2017-18 to 2021-22 largely reflects growing general revenue assistance payments (largely GST) to be made to the States and Territories and the conservative bias allowance component of the Contingency Reserve.
Hang on a minute, something appears to be missing! Let’s have a look at last year’s explanation (page 6-8):
Other purposes — the increase in expenses from 2017-18 to 2020-21 largely reflects growing general revenue assistance payments (largely GST) to be made to the States and Territories, increasing public debt interest costs and the conservative bias allowance component of the Contingency Reserve.
Ah yes, that’s better.
If you’ve been a regular reader of TMR’s budget analysis, then you’ll probably have a fair idea on what’s coming on this. But first, let’s dig a little bit deeper to see where the money’s going. It’s time to roll up the sleeves.
Spending – a closer look
The following expanded table provides a further breakdown on spending for each of the above functions.
In what a hard leftist would probably describe as fascism these days, TMR has put everything in the one table and organised the components of each function according to percentage change (someone send me to The Ministry of Love already):
(Figures are in millions of dollars).
Now that we have some more information, let’s see what else there is to notice.
Gillard keeps on givingtaking
This year’s HFS budget moment comes courtesy of assistance to people with disabilities – which is set to balloon out by an outrageous 29.8% ($11.0 billion).
Would you like to guess the root cause?
…
…
Bingo.
This is what last year’s 2017-18 budget said about how much was going to be spent on the National Disability Insurance Scheme (page 6-27):

Those with sharp arithmetic will notice that the budgeted spend for 2017-18 to 2020-21 (inclusive) was around $64.9 billion (try not to concern yourself with a few tens of millions of dollars here or there: it’ll only lead to pain).
Here is this year’s 2018-19 budget showing how the federal government has completely and utterly lost all control of the spending on this scheme (page 6-25):

As for the 2017-18 to 2020-21 spend, that’s now slated to be around $67.6 billion – with another $23.6 billion coming after that in 2021-22 (PS: would you like to bet the over or under on that one?).
And that, ladies and gentlemen, is how you make $2.7 billion disappear within a year.
That aside, if anyone can tell me what’s actually been delivered under this scheme for the $13 billion or so spent so far – along with who and what qualifies and who and what doesn’t – that would be great:
- 2014-15: $0.6 billion (page 5-30)
- 2015-16: $1.1 billion (page 5-27)
- 2016-17: $3.4 billion (page 6-27)
- 2017-18: $7.8 billion (page 6-25)
- 2018-19: $16.7 billion (budgeted)
By the time 2021-22 rolls along, around $96 billion will have been spent on the NDIS. Of course, this assumes that the current estimates prove correct – and we all know there’s fat chance of that happening.
Another thing to note is that the above $96 billion does not include the $3 billion or so that will have been spent on the NDIS ‘transition program’. Based on the current performance of the NDIS to date, one can only assume that this program is all about helping people transition to life with less coffee in it.
I wonder how long it will be before we all have to forego another cup of coffee each week the Medicare levy is increased again?
For those wishing to complain about the above state of affairs, ask yourself this: you don’t hate the disabled do you?
Good. I’m glad we could sort that out.
Immersing ourselves in other purposes
This category has been the star of the show for some time:
- Firstly, the interest payments on the government’s $586.8 billion debt (see page 6-9) will cost about $17.8 billion in 2018-19 (page 6-43) .
- This $17.8 billion in interest payments is about $3.4 billion more than the $14.5 billion budget deficit that the federal government will be borrowing in 2018-19 to ‘fund our lifestyle’ – and would rank as the sixth most expensive government spending program (see page 6-10).
- In other words, the government is still borrowing copious amounts of money simply to pay (a portion of) the interest on our debt. (TMR: I’m confused Mr Treasurer: is this ‘borrowing money to pay for everyday expenditure’? Or is this the ‘good debt‘ you’ve been talking about?).
- In case anybody cares, the total interest bill since 2007-08 is now around $123.5 billion – and will sail over $141 billion by the end of 2018-19:
- 2007-08 – $3.5 billion
- 2008-09 – $3.9 billion
- 2009-10 – $6.3 billion
- 2010-11 – $9.3 billion
- 2011-12 – $11.4 billion
- 2012-13 – $12.5 billion
- 2013-14 – $13.4 billion
- 2014-15 – $14.5 billion
- 2015-16 – $15.6 billion
- 2016-17 – $16.1 billion (page 6-52)
- 2017-18 – $17.0 billion (page 6-43)
- 2018-19 – $17.8 billion
- Please stop what you’re doing and process this budget crime… if you’re not quite angry enough about this yet, or cannot think of better things we could have done with $141 billion, then go here.
- Moving on, the federal government will have another go at cutting the local government assistance budget to $1.2 billion in 2018-19. It was supposed to do this last year, but didn’t quite make it:
Last year (page 6-44):

This year (page 6-43):

- PS: If anyone can tell me what we got for the billions extra spent on local governments over the last two years, that would be real swell. This was TMR last year on this item (one year on and nothing has changed):
Hang on a minute, let’s get this straight: in 2015-16, the amount spent on local government assistance was $1.1 billion and the budgeted spend for 2016-17 already doubled this to $2.2 billion. Then, actual spending went out to $3.4 billion. Excuse me? Does anyone know why we needed $3.4 billion in federal assistance for local governments last year or how or why the budget blew out by so much? I sure don’t. As for the government’s explanation (at page 6-45):
Expenses under local government assistance relate to financial assistance grants made to the States and Territories and consist of a general purpose component and an identified local road component, both of which are untied, allowing councils to direct the grants to local priorities [TMR: aaaaarghhhh!]. The expenses are expected to decrease by 66.0 per cent in real terms from 2016-17 to 2017-18, reflecting the bringing forward of the first two instalments of the 2017-18 Financial Assistance Grants program for payment in 2016-17. Further information on Australian Government assistance to local governments can be found in Budget Paper No. 3.
By all means, hop on down to Budget Paper No. 3, type ‘local government’ into the word search and go nuts in trying to explain where the money went and why an extra $1.2 billion absolutely had to be ‘brought forward’ last year without delay – on top of the $1.1 billion increase that was already budgeted. That aside, I suppose any time you can use two levels of government bureaucracy to get things done with other people’s money instead of one, then you absolutely must do it before the opportunity disappears or before common sense makes you change your mind.
- Rounding out the show yet again for other purposes this year are the budgeted amounts for natural disaster relief – set at a paltry $17 million for 2018-19, then $10 million for 2019-20… and then a stone cold zero for the next two years after that (see tables above). One can only assume that our action on climate change has already reaped significant benefits by reducing natural disasters.
Ladies and gentlemen, if you will: please give a round of applause for other purposes!
General public purposes
Every year, the government seems to think that it can shave several billions of dollars from this category of spending. Every year, it fails:
2017-18 budget (page 6-13):

2018-19 budget (page 6-11):

This was TMR on this issue last year:
I questioned above how the government expects to cut ‘General public services’ by $6 billion – particularly when this item blew out by $4.5 billion last year. Turns out, all it needs to do is tweak a few things with the ‘Government superannuation benefits’ and, voila! Something that cost $9 billion last year will now only cost $3 billion a year (shhhh, be cool man). Given that this item is worth more than the new Medicare levy and almost as much as the new bankeverybody tax, I’ll leave you to decide what to make of this explanation contained in the budget papers:
The fall in expenses from 2016-17 to 2017-18 in the government superannuation benefits sub-function reflects the use of different discount rates. In accordance with accounting standards, the superannuation expenses for 2016-17 apply a discount rate based on long-term government bonds at the commencement of the financial year (2.7 per cent). Forward years are estimated based on the discount rate applied by the superannuation scheme actuaries in preparing long-term cost reports (6 per cent).
Ohhhhhh – discount rates. I get it now. I’ll have to apply this method to my mortgage.
As for the federal government’s explanation this year, things seem to have been kicked up a notch:
The fall in expenses from 2017-18 to 2018-19 in the government superannuation benefits sub-function reflects the use of different discount rates. In accordance with accounting standards, the superannuation expenses for 2017-18 were calculated using the long-term government bond rate as at 1 July 2017 that best matched each individual scheme’s liability duration. These rates were broadly between 3.0 and 3.5 per cent per annum. Forward years are estimated based on the discount rate recommended by the superannuation scheme actuaries in preparing the latest Long Term Cost Reports (5 per cent). This is lower than the rate of 6 per cent applied in previous Budgets and reflects the actuary’s view that long-term borrowing costs have decreased.
Anyone taking the budget estimates for this category seriously, please come and see me: I have a business idea I’d like you to ‘invest’ in.
Health
As stated above, the government blew out the health budget by around $2.3 billion in 2017-18. Let’s see if we can find out what happened…
This was last year’s health budget (page 6-20):

Here is this year’s health budget – which also includes the latest figures of what is likely to be actually spent for 2017-18 (page 6-18):

As you can see, it looks like the heavy spending was done in the areas of assistance to States for public hospitals and pharmaceutical benefits. As for the government’s explanation of how these areas of the budget were blown out by around $1.9 billion (5.9%), feel free to head on over to pages 6-18 to 6-22 if you’re interested in crickets chirping.
Move along everyone, there’s nothing to see here.
General administration
The federal pen-pusher index is always interesting to pay attention to. Here are this year’s main budget figures:
- Agriculture, forestry and fishing: an insane 25.1% ($772 million) of the function’s budget (the second highest item).
- Social security and welfare: 2.3% ($4.1 billion) of the function’s budget (to be fair, this is budgeted to be 0.2% less than last year – let’s hope this actually gets done).
- Health: 4.2% ($3.35 billion) of the function’s budget.
- Education: 1.1% ($373 million) of the function’s budget.
Aside from the $8.6 billion being spent overall on these four areas of administration (there are countless others), if someone could sensibly explain how this set of circumstances came to be, that would also be great.
Conclusions
If I ran my life like the federal government has run the budget for the last 10 years, then it’s safe to say that lenders wouldn’t exactly be queuing up to lend me more money – and I probably would have declared for bankruptcy by now (actually, make that three or four bankruptcies under Turnbull’s proposed new rules – set to be introduced soon).
There have now been five Liberal government budgets and we still don’t have any real surplus in sight – or any indication of how and when our debt is going to be sensibly paid back. A proposed surplus of $2 billion in two years’ time doesn’t even come close to cutting it: not when our federal debt will have sailed well over $600 billion and not when a Labor government could be in power by then to add more to the pile.
This, more than anything else, is what continues to cripple our nation’s finances and economy.
If you’re wondering why your pay has been stuck in neutral, gone backwards in real terms or just plain gone backwards over the last five or so years, then look no further than the:
- $400 billion debt that Rudd, Gillard and Swan senselessly racked up*; and
- complete lack of political fortitude that the Liberals have demonstrated in dealing with the problem since taking office in November 2013 (unlike Howard and Costello, who managed to balance the books by their second budget – with revenue levels of only 24% of GDP).
As a result, what we have this year is largely an anonymous budget: one that is a slave to the ghosts of budgets past. Everything is more or less the way it has been for the last 5-10 years. The only real differences this coming year will be the $11 billion added to the welfare bill for the NDIS and the $17.8 billion of interest being paid on the steaming pile of debt. In other words: Labor’s vision carried forward to its logical conclusion.
Lastly, anyone who thinks we’re a country that leaves its most vulnerable and in-need people behind should consider this: in 2018-19, 68.9% of the spendable portion of the federal government’s budget will go to health, education and welfare. That is:
- $78.8 billion (health); plus
- $34.7 billion (education); plus
- $176.0 billion (welfare); divided by
- ($488.6 billion (i.e. the total 2018-19 budget spend) minus $68.3 billion in GST payments to the States and Territories).
The irony of it all is that with all the money borrowed to fund this extraordinary level of spending, the $123.5 billion in interest payments made so far show that there will be less to spend on these things in the future. The government’s haste to fund unaffordable programs like the NDIS and Gonski with borrowed money over the last 10 years has done little more than to help grind our economy to a halt and freeze people’s wages – with no end in sight.
As for this year’s budget song, who would have thought that Bon Jovi could be so prophetic? No matter whether you look at this from the perspective of our politicians or us as the their playthings, this just seems to work on every level when it comes to the state of our nation’s finances…
Once upon a time not so long ago
Tommy used to work on the docks, union’s been on strike
He’s down on his luck, it’s tough, so tough
Gina works the diner all day working for her man
She brings home her pay, for love, for love
She says, we’ve got to hold on to what we’ve got
It doesn’t make a difference if we make it or not
We’ve got each other and that’s a lot for love
We’ll give it a shot
Woah, we’re half way there
Woah, livin’ on a prayer
Take my hand, we’ll make it I swear
Woah, livin’ on a prayer
(*) People like Shane Wright comically think that Rudd implemented critical spending cuts that delivered the $19.8 billion surplus for 2007-08 after he came into office – and seem to think that this somehow matters even if were true.
As for the truth:
- this is the 2007-08 federal Costello budget predicting $235.6 billion in spending (page 6-5);
- this is the 2007-08 Costello mid-year economic and fiscal outlook prepared in October 2007 predicting a slighter smaller spend of $235.4 billion (page 27);
- this is Kevin Rudd getting elected in November 2007; and
- this is the actual 2007-08 spend getting blown out of the water to $294.9 billion (page 11-6).

For many, I suspect that as in Greece and elsewhere the black economy will become essential. My own work, little as it was, ended when the news came that I cost too much to employ. Don’t get to fifty years of age without a position from which you can sack others but only with difficulty be sacked yourself.
LikeLiked by 1 person