
If you want simple, no-nonsense budget analysis that can’t be found anywhere else, then read on.
All figures have been sourced from the official 2016-17 budget papers and are presented so that you can form your own opinion.
For some fun at home, try to guess which spending item scored the biggest percentage increase. I promise you’ll be unpleasantly surprised.
Revenue
I’m not going to go into great detail on the revenue side of the budget. I’ve already shown on numerous occasions how the government doesn’t have a revenue problem. In this respect, regular readers will be very familiar with this graph generated by The Marcus Review following last year’s budget papers:

It’s now time for the updated version:
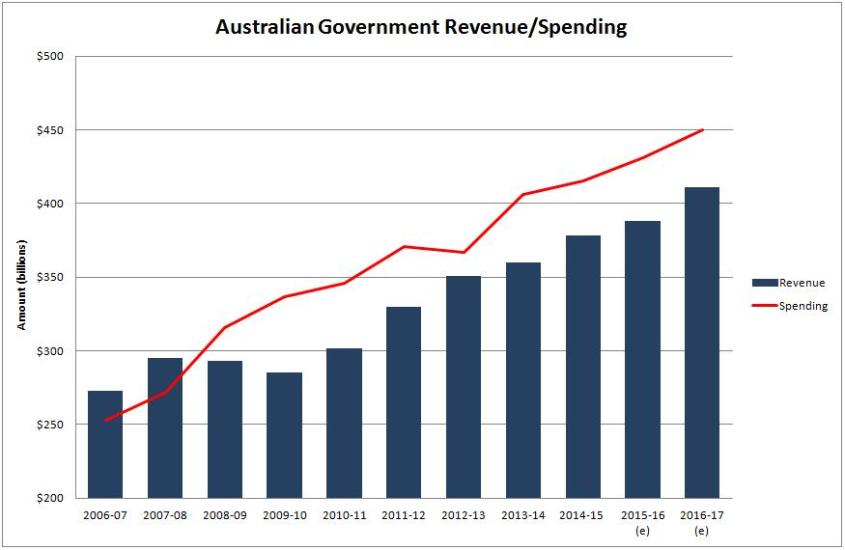
In short, government revenue for the coming year is projected go up by 6.0% (up from $388 billion to $411 billion).
This year’s tax victims are smokers, self funded retirees, those aiming to be self-funded retirees and ‘evil’ multinationals who don’t pay their ‘fair share’.
Given that there are only so many feathers one can pluck from a duck, it will be interesting to see if the government actually increases it’s revenue by 6.0%. Call me sceptical, but the government’s GDP forecast looks pretty optimistic.
Spending – general overview
The analysis here couldn’t be simpler: look at spending for the financial year about to end (2015-16), compare it to the budgeted spend for the next financial year (2016-17) and see where the biggest changes are.
Looking at anything beyond the upcoming 2016-17 financial year is pointless. Governments are already worse than the IPCC when it comes to forecasting (see charts 7, 8 and 9 here for example*) and the fact that there’s an election around the corner amplifies this. Let’s just stick with the most certain information we have available. Trust me when I say it’s about to tell us a lot.
For each major government function, the following table shows:
- spending for the 2015-16 (about to end) and 2016-17 (budgeted) financial years; and
- the budgeted increases and decreases in plain dollar and percentage terms.
For further ease of reference, the functions have been ordered by percentage change.
Due to the revolutionary method used, this table is exclusive to The Marcus Review (figures are in millions of dollars):

The first thing to note is that the government intends to increase overall spending by by 4.4% ($19.1 billion). To put this in some perspective, the current inflation rate is 1.3% and the annual wage growth rate is 2.13% (2.0% for the private sector and 2.6% for the public sector).
That aside, the following may have come across your mind on reading the above table:
- People involved with government transport projects look like they’re about to have a really good time.
- How many other things in the economy are going to grow by 28.7% in the next year?
- Why is welfare being increased by $5.7 billion?
- Is growing the welfare budget by 3.8% – while workers’ wages are growing at 2.13% – really going to help the economy?
- Why have agriculture, forestry and fishing (12.8% spending growth) and housing and community amenities (8.6%) been given such large percentage increases ($771 million overall)?
- Have general public services really been cut by 5.5%? Would Turnbull really sanction a legitimate 5.5% cut to anything – especially right now?
- ‘Other purposes’?… Eh?
- Seriously, what’s the deal with ‘other purposes’? Why does it need another $6.7 billion? (8.1% increase). You’ve got to be effing kidding me!
For those not familiar with ‘other purposes’, allow me to put it in the government’s own words:
Other purposes – the increase in expenses from 2016‑17 to 2019-20 largely reflects growing general revenue assistance payments (largely GST) to be made to the States and Territories, increasing public debt interest costs…
Oh yeah, there’s plenty more on that coming. But first, let’s dig a little bit deeper into the budget – there’s a lot more to discover.
Spending – a closer look
The following expanded table provides a further breakdown on spending for each function. In what can only be described as a federal budget analysis ‘game-changer’, The Marcus Review has ‘radically’ put everything in the one table and organised the components of each function according to percentage change (I know, I’m a crazy guy):

Now that we have some more information, here are some extra things to note:
‘Other purposes’
For the reasons you are about to see, ‘other purposes’ is the star of the budget:
- Firstly, the biggest percentage increase winner of this year’s budget is… ‘local government assistance’ at 100.1% ($1.1 billion). How did you go with guessing that one? You get extra points if you also realised that we now have a situation where some State governments are actively trying to amalgamate various local councils – at the same time as the Turnbull government is arming them to fight back.
- I’ll wait while you go and smash your head into the corner of a filing cabinet…
- … and we’re back.
- ‘Other purposes’ strikes again with $16.6 billion being paid in interest on government loans (i.e. accumulated budget deficits) – an increase of 8.2% ($1.27 billion). This now brings the interest bill for the last 10 years to well over $100 billion:
- 2007-08 – $3.5 billion
- 2008-09 – $3.9 billion
- 2009-10 – $6.3 billion
- 2010-11 – $9.3 billion
- 2011-12 – $11.4 billion
- 2012-13 – $12.5 billion
- 2013-14 – $13.4 billion
- 2014-15 – $14.5 billion
- 2015-16 – $15.6 billion
- 2016-17 – $16.6 billion
- By the time the debt hits its peak (somewhere around $500 billion), total interest payments will have sailed over $150 billion. All we can do from there is guess what the final bill will be by the time the debt is under control.
- Extra note 1: the increase in assistance to States of 5.2% ($3.0 billion) is comprised almost entirely of increased GST receipts.
- Extra note 2: in case you’re interested, the minus $1 billion figure in the contingency reserve is little more than dodgy number shuffling. While the money is not ‘appropriated’, it allows the government to make the budget look $1 billion better this year, while being forced to put $6 billion in the other direction in 2019-20 (i.e. the bit where where nobody is looking or cares about):
The Contingency Reserve sub‑function comprises the Contingency Reserve, which is an allowance that principally reflects anticipated events that cannot be assigned to individual programs in the preparation of the Australian Government budget estimates. It is used to ensure that the estimates are based on the best information available at the time of the Budget. It is not a general policy reserve and is not appropriated.
Allowances that are included in the Contingency Reserve can only be drawn upon once they have been appropriated by Parliament. These allowances are allocated to specific entities for appropriation closer to the time when the associated events occur.
Environment
- Turnbull has secured his ‘climate credentials’ by increasing road spending from $5.5 billion to $7.97 billion (a 44.9% increase). This has helped his government to be the first ever to go over $10 billion in annual transport spending (the previous high was $9.1 billion in 2011-12).
- Get your motor runnin’.
- Head out on the highway.
- Looking for adventure.
- In whatever comes our way.
- Sorry, I digress…
- Speaking of climate, ‘Environment protection’ has scored itself a 14.6% ($131 million) raise. This is largely due to the Emissions Reduction Fund:
Expenses are estimated to increase by 12.6 per cent in real terms from 2015‑16 to 2016‑17 primarily reflecting the continued implementation of the Emissions Reduction Fund.
(Personally, I think we could achieve the same or even better results and save ourselves $100 million by giving the CSIRO $30 million to look into reducing the incidence of flatulence in cows. Surely there’s a way?).
- ‘Natural resources development’ is going up by 32.7% ($319 million) and explains why the agriculture budget has increased by 12.8%. Would it help if I said that the government was taking ‘water reform’ very seriously? (You didn’t think it was going to farmers did you?):

(a) The entry for each component includes eliminations for inter-agency transactions within that component.
(b) Water Reform includes the following programs: National Partnership Payments — Water and Natural Resources; Water Reform; and Commonwealth Environment Water.
Welfare
- Unnecessary welfare continues to be a huge drain on the economy. The main increase here is to people with disabilities (14.8% – $4.3 billion). This is basically Gillard’s NDIS scheme now coming home to roost. It comfortably takes out this year’s budget award for biggest dollar increase.
- Assistance to the aged has increased by 5.5% ($3.27 billion). While nobody would ever begrudge an extra helping hand to an elderly person in need, the fact is that this part of the budget is a time bomb in serious need of reform. At $63 billion, it’s comfortably the biggest spending item in the entire budget (it’s bigger than education and defence put together and closer than you think to the entire health budget). Our population is rapidly ageing and 80% of retired people rely on welfare. So far, there has been absolutely no political fortitude shown towards fixing this problem.
- The ‘SchoolKids Bonus’ has been mercifully abolished – such that assistance to families with children has been cut by 3.3% ($1.3 billion). This is one of the braver things the government has done and it should get credit for this. Families on $150,000 don’t need welfare.
Best of the rest
- ‘Medical services and benefits’ will go up by 4.0% ($1.1 billion). This is essentially the cost of the Medicare system ($22 billion) and private health rebates ($6.5 billion). It is interesting to note that the increase here is three times the current inflation rate. Anyone who says the government is making ‘cuts to health’ (which is increasing at about 2.5 times the current inflation rate overall) is talking rubbish. The fact is that we have the exact opposite problem. The only major cut to health is the $106 million (3.4%) reduction to general administration which is long overdue.
- Julie Bishop has done very well for herself. The foreign affairs and economic aid portfolio will get a very healthy increase of $620 million (11.3%). I wonder why this spending item was prioritised?
- Labour market assistance to job seekers will increase by 26.8% ($400 million). This is the government’s program to encourage businesses to take on unemployed youths. Time will tell if we get our $400 million’s worth.
- Despite being a State responsibility, public schools have secured an 11.7% ($675 million) raise. Private schools have also been given a healthy raise of 6.9% ($685 million). So far, there is no detail as to where exactly this money is going to go.
- Overall, education spending will increase by more than 2.5 times the current rate of inflation. Of course, that won’t stop the ‘cuts to education’ outrage brigade – particularly from the higher education sector where there has been a $59 million (0.6%) cut.
- Given that the public service hasn’t exactly decreased by 39.3%, it’s interesting to see that government superannuation benefits are going to fall by this amount ($2.5 billion) over the next year. If you’re confused, perhaps the government can help explain (table 4.2):
The fall in expenses from 2015‑16 to 2016‑17 in the government superannuation benefits sub‑function reflects the use of different discount rates. In accordance with accounting standards, the superannuation expenses for 2015‑16 apply a discount rate based on long‑term government bonds at the commencement of the financial year (3.7 per cent). Forward years are estimated based on the discount rate applied by the superannuation scheme actuaries in preparing long term cost reports (6 per cent).
(Hmmm).
Is this a good budget?
All other things being equal, this is yet another horrible budget for the simple reason that spending is still running rampant with no appreciable return.
On current figures, another $100 billion will be added to our federal debt – with the government’s loan balance peaking at somewhere around $500 billion. The interest payable on all of this is diabolical. And what have we got to show for it all? The economy is growing at a snail’s pace and people’s wages have been practically frozen for years.
Of course, the reality is that all things are not equal and it’s simply not fair to lay the blame entirely on Turnbull and Morrison (or Abbott and Hockey) for not being able to fix Labor’s budget crimes within one term of government – particularly with the Senate issues they have faced and an election coming around the corner.
The most encouraging part of the budget is the expansion of cuts to small business company tax rates (I’m talking about the actual ones that will happen over the next year, not the rubbery aspirational stuff beyond that which hasn’t been costed or modelled). So far, it’s the only thing providing hope that our country can dig itself out of this fiscal mess.
(*) with thanks to Judith Sloan and Catallaxy Files.
(**) please remember that there is only one of me and I cannot possibly see everything worth noting in the budget. If you’ve noticed something important which I haven’t, please don’t keep it to yourself: let everyone know in the comments section below so that we can all be better informed.

Wow. Thanks for this analysis. Our current crop of “journalists” haven’t done anything similar that I’ve seen. It’s all been about “what’s in it for me”.
So we know that there is at least $3.5Bn of creative accounting going on here. Next year’s actual deficit is closer to $40Bn.
If you put a trend line on your graph, we could see if the budget spending is above or below trend. This would help burst some of the B/S being spouted by MT and ScoMo.
LikeLike
Thanks for the suggestion AP. I’ll have a look into what a trend line shows. I would expect the trend line to show the rate of spending increasing under the Liberals. Some of this is just plain gutlessness and waste on the part of the Liberals. However, a massive chunk of it is due to the spending that was entrenched during the Gillard years – she laid land mines all over the place that were never going to spring during her term, but later on (e.g. NDIS and Gonski). These things completely wedged the Liberals.
LikeLike
I appreciated your essay, which I found through OnLine Opinion, and built my own Budget post around it. http://www.donaitkin.com
LikeLike
Hi Don, thanks for the kind feedback. I enjoyed reading your post and navigating the rest of your blog.
LikeLike
Thanks for making sense of the fireworks display. The budget is out of control again.
LikeLike
Thanks Logical. The budget’s been out of control for 9 years and counting now.
LikeLike
The 39.3% fall in government superannuation benefits seems modest. I understand that up here in Queensland the latest state budget doesn’t provide anything for government superannuation benefits. Ah Queensland, beautiful one day ………………….
LikeLike
In Revenue should million be billion (first line after the graphs)?
LikeLike
Well spotted, correction made. Thanks wyzelli.
LikeLike